
Streamlined S-Curve Reporting Made Simple
Project management is full of indicators. They cover anything from change order impacts and rework, to risks, issues, and opportunities. Yet there is one type of indicator that project teams need to see often, and without having to jump through hoops to get it. It’s the one that shows at a glance whether a project is on track in terms of what it cost so far, compared with what was budgeted. The one that shows how much longer the project will take to complete. The one that speaks volumes to senior management, project leaders, team members, and practically all other stakeholders.
The Oh So Popular S-Curve
Yes, we’re talking about the S-curve, a critical reporting tool in project management. On one screen, and in an entirely intuitive way, an S-curve lets you visually track both the progress of a project over time and the use of resources in this project. It helps project teams identify project growth, slippage, and target-to-actual project progress. PMO auditors salivate over the S-curve since it measures financial health via the Cost Performance Index (CPI) or the ratio of earned value (EV) over actual costs (AC), with clear insight into the past, current, and projected financial and schedule health of a project in aggregate or by work breakdown structure (WBS). Sales and marketing directors love the S-curve since it immediately shows them how well the company is meeting a customer’s expectations and being profitable by staying within budget.
How Do You Deal with Complex Project Data?
But how do you get to the S-curve? As projects become more complex, there may be more to generating this crucial indicator than meets the eye. S-curves require cost data to be gathered and synchronized across project schedules. This level of data integration and reporting between different project cost and scheduling systems can be challenging. S-curves also need to be up to date, directly available, and easily customizable, so that you get the key information you need, whenever you need it, and in a way that makes it the most accessible to you.
The LoadSpring Cloud Platform Condenses Information Sources
The answer (as you probably already guessed) is provided by LoadSpring and LoadSpring Cloud Platform – in fact, more precisely by the LoadSpringInsight functionality. This functionality makes it easy to display your S-curve report, immediately when you and your team login. We enable you to connect core applications and visualize the S-Curve reporting you need, to help you make decisions in a timely fashion. Your S-curve reports are as real-time as the data within the respective applications. Consequently, you are no longer reacting to old information. Instead, you are positioned to proactively drive the next steps to keep the project on budget and schedule.
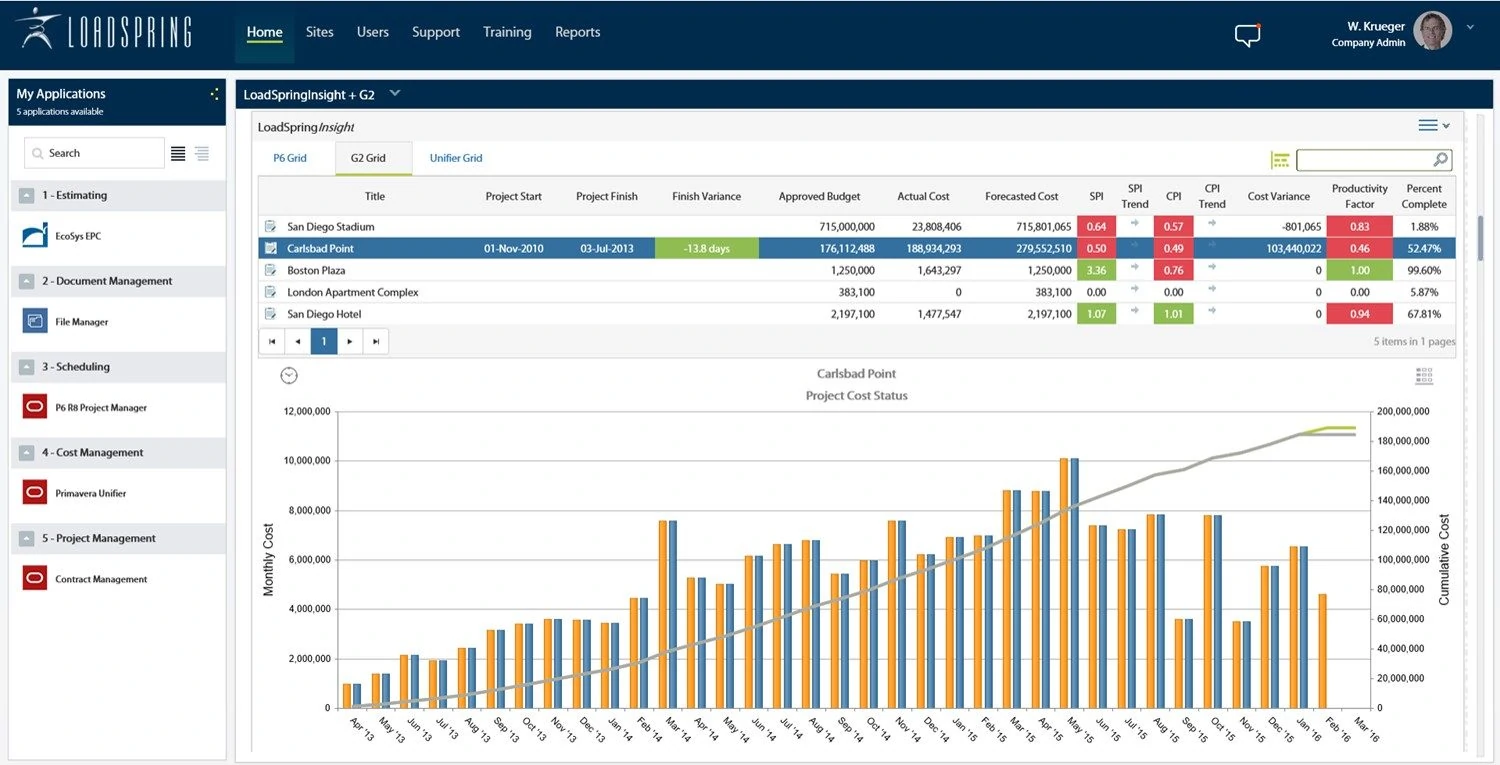
Example of an S-curve displayed in LoadSpring Cloud Platform dashboard
LoadSpring overcomes the interoperability and reporting challenges to provide off the shelf S-curve reporting for any combination of the solutions outlined below:
PROJECT COST MANAGEMENT
PROJECT PLANNING & SCHEDULING
LoadSpring and LoadSpring Cloud Platform Lead the Way
In general, LoadSpringInsight functionality, available only on LoadSpring Cloud Platform, streamlines S-Curves for your best-of-breed project cost and schedule applications. In fact, the LoadSpring Cloud Platform is the only tool that connects directly to your cost application or scheduling applications for this crucial real-time at-a-glance information. If you’re not yet using LoadSpring for this and much more Cloud Project Management functionalities, contact us today and see how soon you could be getting all the advantages for your own projects! +1 (978)685-9715 or information@loadspring.com.