

GIS Map is your Universal User Interface
By Ty Van Den Akker, Director of Commercial Services, Critigen and Michael Dawson, Strategic Account Director, LoadSpring Solutions, Inc.
Looking for a more meaningful way to view data from multiple sources in a single place? Wish you could pull your project data together like Google Maps brings together information on all sorts of businesses, traffic, terrain, and other than location? Companies are increasingly turning to cloud-based map applications to visualize information from design, right of way, permitting, scheduling, maintenance, document, financial, and compliance tools together on a single interface.
With asset and infrastructure related firms, most data ties directly to a place or location (attributes are associated with a longitude and latitude, and sometimes elevation). Rather than spending millions on back-end integration of datasets, or integration of best of breed systems, engineering and construction firms are turning to interactive maps, allowing location to be the key to integration and understanding.
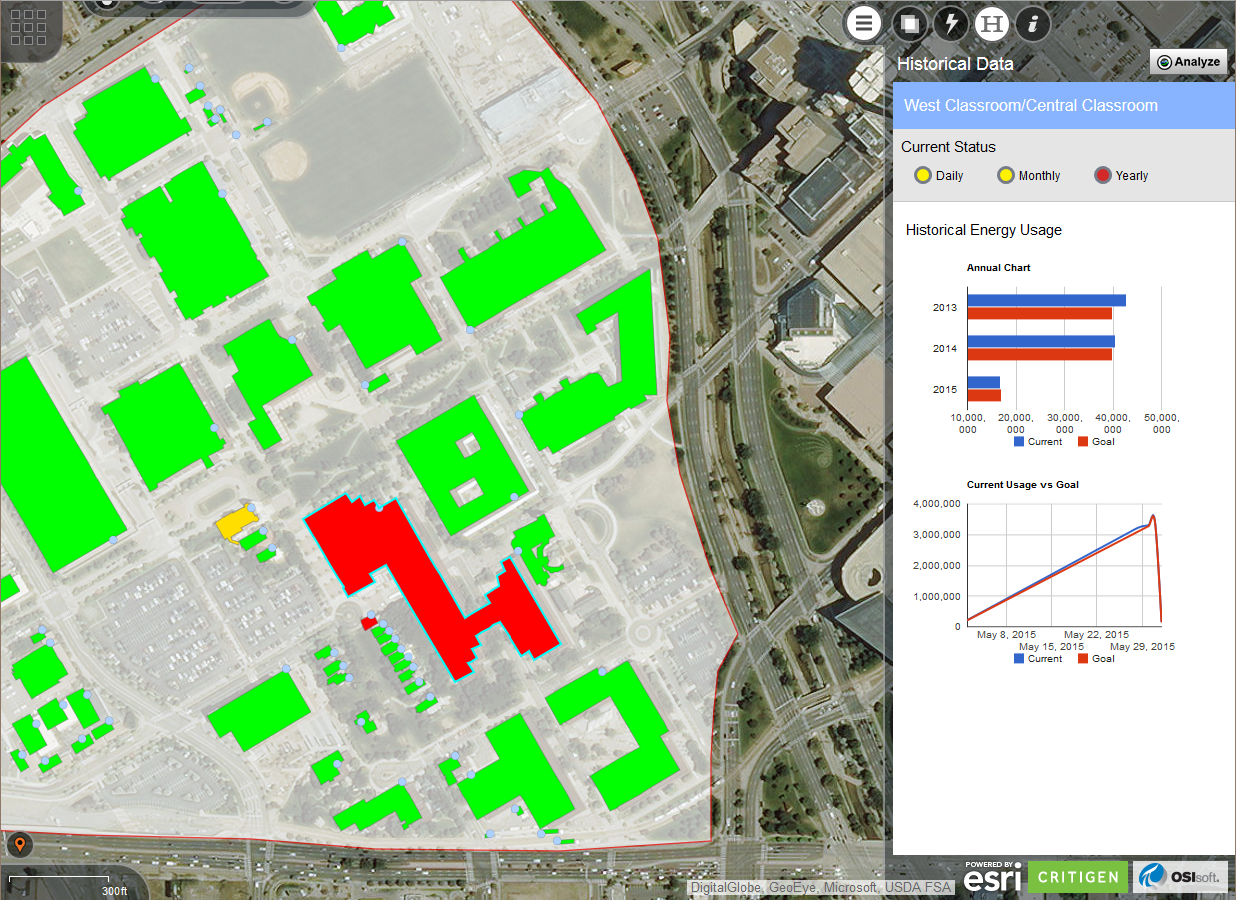
Map-based dashboards leverage data that is already being produced for the project. They provide direct access to environmental data, campus plans, and other data in the project’s Geographic Information System (GIS) and provide easy integration with free, high quality sources of aerial imagery.
Single Point of Access for Project Information
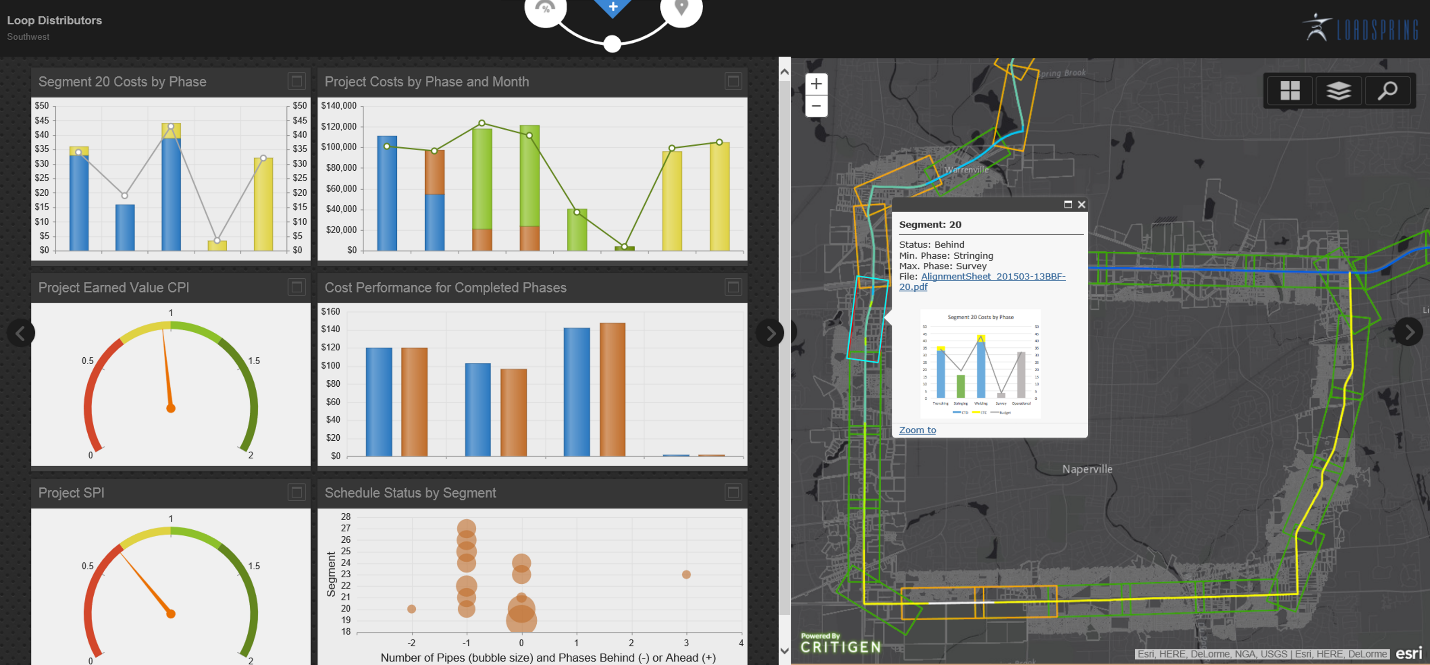
Applications built on top of map-based interfaces and map-based integrations allow intuitive navigation of project information. And, there’s no reason to stop with environmental data. For example, scheduling data that is brought into ArcGIS can also show where work is planned, where work is currently in progress and where it is behind schedule. Correlating schedule status with specific environmental or cultural features can lend important insights into reasons for delays or unexpectedly quick progress.
The ability to provide document access and details of the assets being constructed or maintained from the same interface as schedule and environmental information means clients, managers, and other stakeholders have a single point of access for the most detailed project information. And this access comes without requiring a user license for Primavera, AutoCAD or other source systems and only requires a single login.
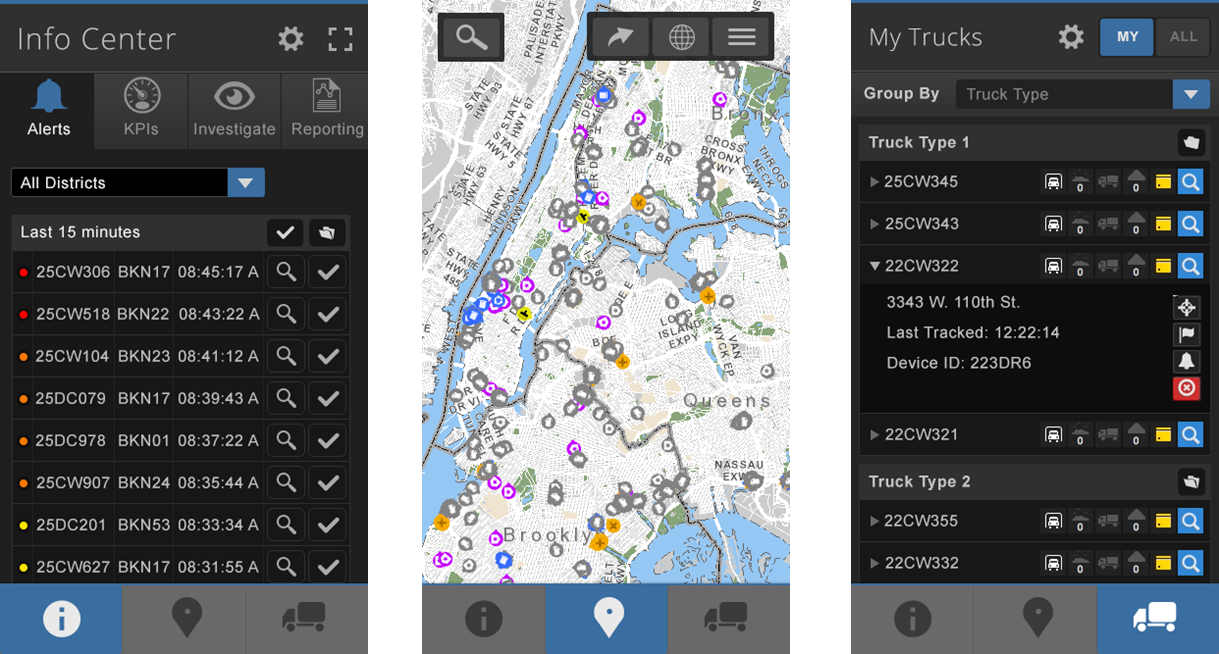
Mobile GIS
The Esri ArcGIS Platform now allows developers to create map applications and dashboards that work well on any screen size and on any device using HTML/JavaScript/CSS. This allows executives to use tablets to view virtually all project information. Field users can also use mobile phones, tablets, Toughbooks, and other devices to review project status and asset information while in the field through a simple, singular interface. Rather than developing a completely separate mobile application, HTML5 applications can be made “responsive” so that the layout and functionality simply adapts to smaller screen sizes.
Why is GIS important to my organization?
Many organizations have considered using GIS map but often don’t know where to start or how it benefits them. Here are some of the key benefits of integrating your project data with GIS tools.
- GIS is easy for people to use. The map is simple and increasingly familiar – much more intuitive and rich than spreadsheets.
- Maps provide a common space for stakeholders to interact with vendors and data from different systems, all while allowing simultaneous presentation of tables and charts linked to GIS map features and asset information on the map.
- Maps provide a window into specialty applications without requiring users to have exclusive licensing for the application (e.g. MicroStation, P6, etc.).
- GIS applications help stakeholders visually spot trends and risks by putting them together in space. It also provides the ability to drill down to more detailed information.
- Integration of data through GIS is a proven approach that is now available via simple mobile interfaces for everyone to interact with.
- Providing accurate, real time communication with the client via GIS is a competitive advantage for engineering and construction firms.
SpringBoard GIS
LoadSpring™ has teamed with Critigen™ to deliver web-based GIS applications to our clients via the SpringBoard. Dashboards for a construction program are linked to engineering data and construction progress data, set by construction managers in the field. Integration with P6 shows where the work is ahead or behind schedule. Popups provide links to documents from SharePoint or other enterprise document systems, and a pull-out dashboard provides quick reference to financial metrics for the project.
Every LoadSpring customer uses a different mix of project management applications that store data on status, documents and design information. Hosting a GIS environment at LoadSpring with integration services from Critigen allows them to work together effectively and efficiently. Using GIS-based solutions, construction managers in the field can update activity progress through the GIS application, which feed back into project management tools. GIS dashboards can then highlight areas with potential risk or cost overruns.