


Use the Right Data to Make Your Project Analytics Meaningful!
By Alexander Vos, Director of Services and Delivery, LoadSpring Solutions
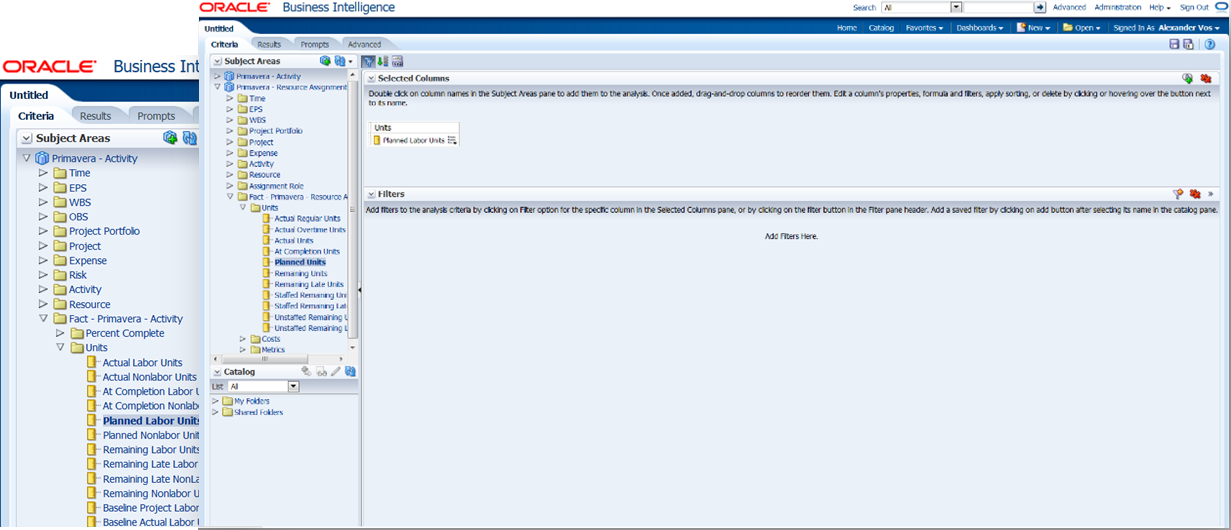
When creating an analysis in Primavera Analytics, a subject area must be chosen for the data to be used in project analytics. There are multiple subject areas, making it critical to select the correct one to ensure you get accurate results. The first screen shot shows a few examples of those subject areas. It is possible to use other subject areas or data sources for the analysis, but doing so will require customization.
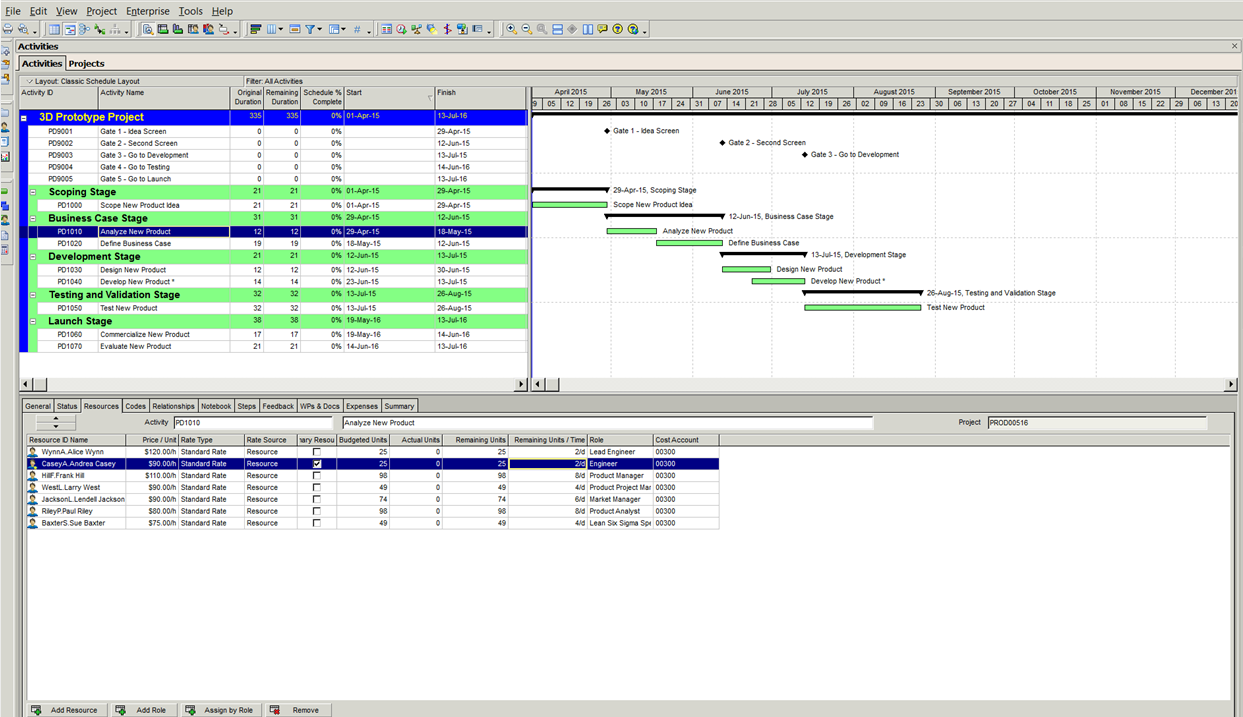
We will focus here on the various subject areas related to resource assignments. With many resource-loaded schedules, there is more than one resource assigned to an activity. In the screen shot below, there are 7 resources assigned to the “Analyze New Product” activity. P6 typically rounds the data for each resource in the display. The total using these rounded figures would be 418 units. However, when you modify the user preferences to see the decimals, the total is actually 417 units.
This is an important point to remember when verifying the data between P6 and Analytics, as Analytics would show 417 units.
The P6 screen also lets us see which resource is declared as the primary resource for which activity. In the screen shot example, we can see that the resource “Andrea Casey” is the primary resource (the corresponding box has been checked) for the “Analyze New Product” activity.
Now let’s switch gears to Analytics. Within Analytics you typically need a “Fact” component for analysis for graphs and visuals. In this example, the two subject areas chosen are “Activity” and “Resource Assignment”. The “Fact” selected for “Activity” subject area is “Planned Labor Units” and the “Fact” selected for “Resource Assignment” subject area is “Planned Units.”
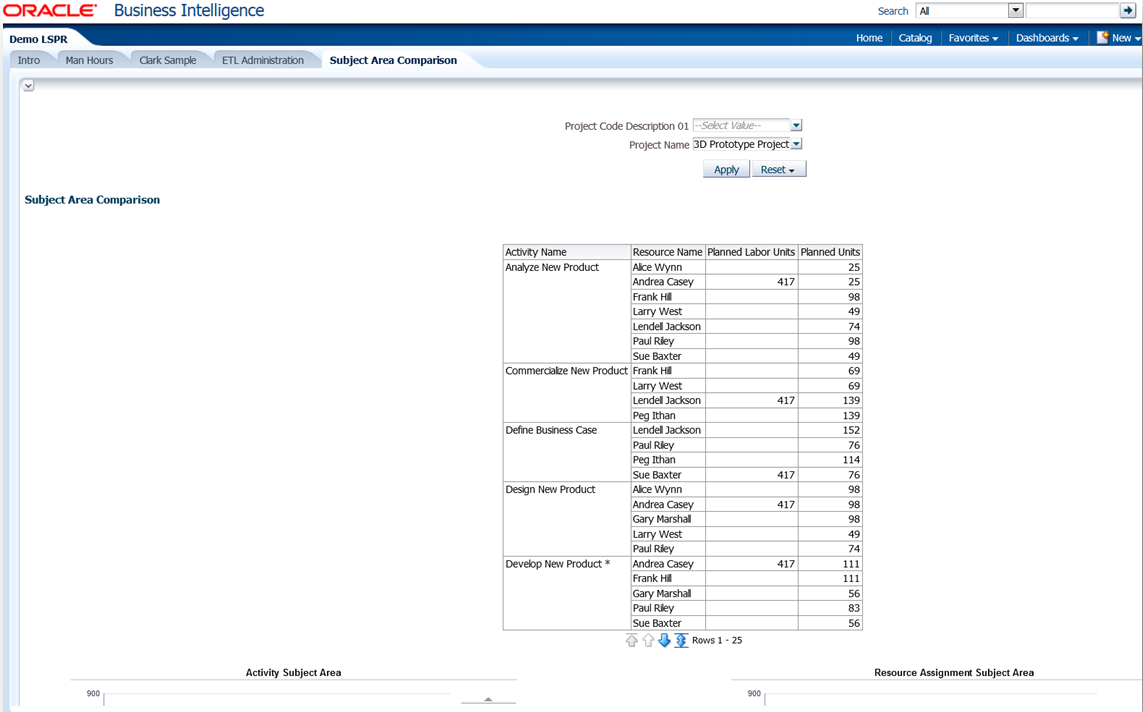
Now in the screenshot that follows, we see a table that was created to show the two different “Facts” side by side. As you can see, when using the “Activity” subject area, Analytics sums all of the units and assigns that total to the primary resource. Thus, “Andrea Casey”, the primary resource for the “Analyze New Product” activity, is assigned all of the “Planned Labor Units” for the “Activity” subject area in that case. However, Andrea is not the only one working on this phase of the project. The “Analyze New Product” activity shows 6 other resources also working on this activity. The second column that corresponds to the “Resource Assignment” subject area shows the ‘real’ distribution of “Planned Units” between all 7 resources.
When the data for both “Facts” is presented in a bar chart, you can see even more clearly how different the displays become. The “Activity” subject area only shows 3 different resources over the entire project period for 2015 and 2016. By comparison, the “Resource Assignment” subject area shows all 10 of the individual resources assigned to the project.
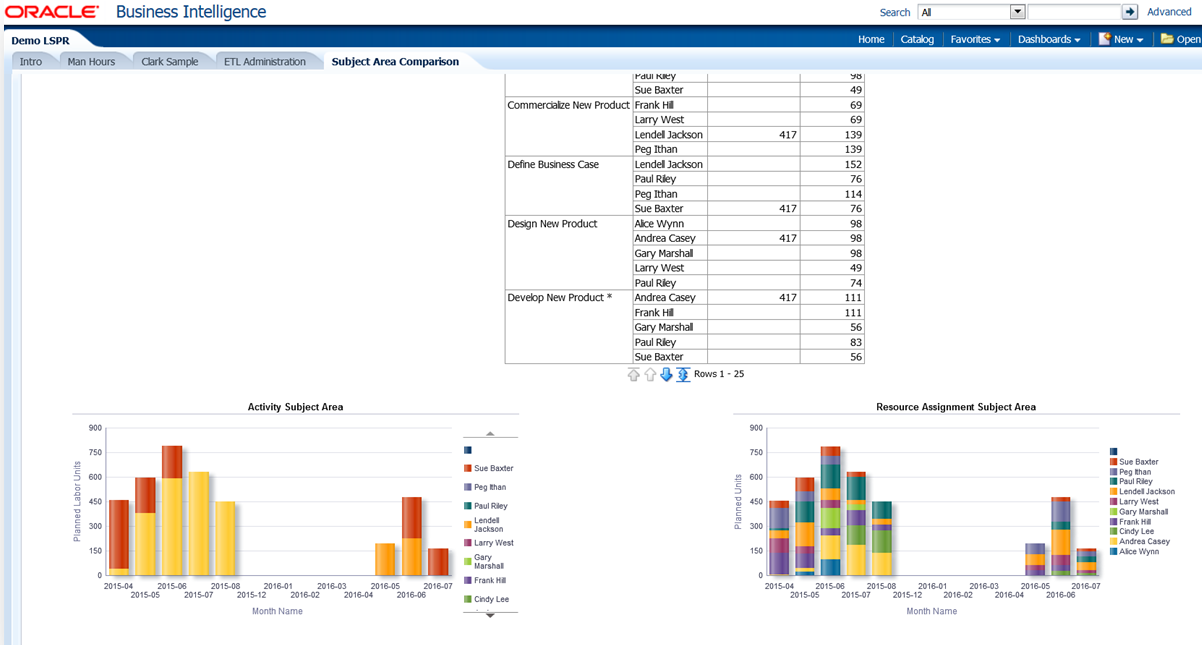
While both graphs ‘look’ nice, only one graph shows the accurateresource distribution for all 10 resources, the “Resource Assignment” subject area. Therefore, before deploying Primavera Analytics to your corporation, ensure the data is being drawn from the appropriate subject areas in order to give your users the correct answers to their questions.