
Primavera Analytics for Psychic Business Power! Part 1 of 3
By Alexander Vos, Director of Services and Delivery | LoadSpring Solutions, Inc.
Congratulations! Your Primavera software already gives you the real-time skinny on your project. Knowing where you are now is good. But wouldn’t you also like to know where you’re likely to be going in the future? That’s what Primavera Analytics has been built for. It’s a separate analytical software that works with the Primavera P6 project management application to give you additional crystal ball capabilities.
What Data Can You Work With?
Primavera Analytics also uses the Oracle analytics platform called OBIEE or Oracle Business Intelligence Enterprise Edition. Some of the P6 project management information cannot make it through OBIEE and cannot be used for insights or trend analysis in Primavera Analytics. But don’t worry, there’s plenty of other information that does: for the technically minded, any data in the fields in the ‘P.x’ extended schema.
Making the Data Connection
There are two processes for transferring data from P6 to Analytics (via the OBIEE base): Publication and Extract-Transform-Load, commonly known as ‘ETL’. The good news is that both processes are designed to be automated and scheduled. Better still, our cloud project management experts at LoadSpring Solutions can assist you in setting them up. You can breathe a sigh of relief now.
Drill Down till You’re Dizzy
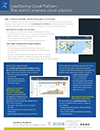
Primavera Analytics lets you zoom in and out of project information detail in ways that could make you dizzy. You can see your top-level project summaries on a map of the US. Or drill down level by level, to see projects per state, activities ahead or behind schedule, resources by state, by portfolio, by project, by project activity… Is there no limit to the fun you can have? True, data cannot be edited in Analytics (only back in P6), but that keeps people honest!
How to Make Primavera Analytics Useful
Start with the end in mind – in other words with the questions that you want answered. For instance, you might want to know if globally a project is on schedule or flag any specific factors causing delays. Or you might need to understand if the current rate of man-hours being worked on a project will allow it to stay on time, within budget or (preferably) both.
Your Dashboard will have the Answers
Once you know what you want to know, use Analytics to create an analysis or indicator from the data transferred from Primavera P6 (see above, Making the Data Connection) to answer each separate question. You can then drag and drop analyses and indicators into a dashboard to see them in one place on your screen. Visualization of dashboards works on smartphones as well as PCs, thanks to an app from Oracle available through the app store.
Stay Organized
Yes, it’s so exciting, but stay on top of things! Organize your analytics end goals into corresponding folders (a separate folder per goal/analysis). This will help you if you want to move analyses from one dashboard to another. Try your hand at a few simple analyses first of all before putting them all together in a larger dashboard.
Copy Shamelessly (Recommended!)
Check out the demo dashboards that are supplied with Primavera Analytics. They can be useful shortcuts to getting what you want. A dashboard has ‘prompts’ or project codes that pick out the projects to be analyzed. There are also activity codes for more detail within a project. By replacing these codes with your own in the demo dashboards, you’ll immediately see how your own projects and activities look.
Coming up next in part 2 of 3: selecting the correct subject areas when building your project reports (so that you can win friends and influence people).